


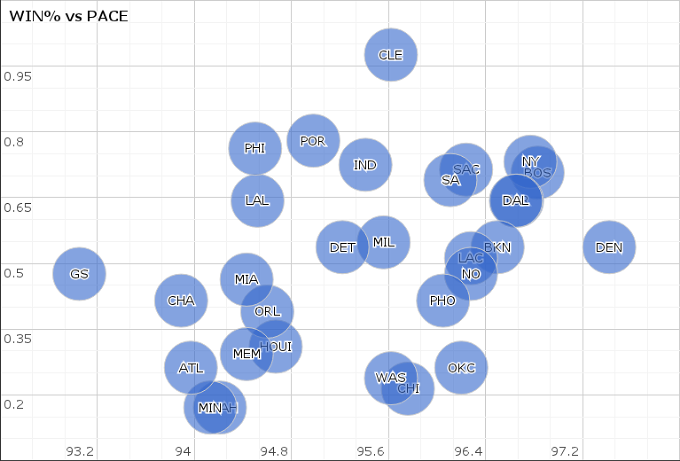
NLL Insider - Correlations and Conclusionsby nick, updated on Sunday, February 09 2014, 11:17 pm EST Correlations and Conclusions We're all looking for that winning formula. Whether it's coach profiles, roster, playbooks, or rotation choices, we're all trying to figure out what magical ingredient wins games. Taking inspiration from the great graphmig, i decided to take a look at some of my beloved advanced team statistics, and check out their relationship to winning percentage. Possessions are, without a doubt, the most important aspect about basketball. The basic fundamental aim of the game of basketball is to score more than the other team to win. Without possession, you cannot score. All of the complicated intricacies of basketball boil down to this exact simple truth. In attempting to score, you lose possession until it is regained. Therefore creating a risk factor. A missed shot is a wasted possession. A turnover is a wasted possession. An offensive rebound is a regained possession. That is why ability and efficiency is so important. When the opposing team has possession, the aim becomes stopping them from scoring and regaining possession. Thus why defense is so important. Why again? Because without possession, you cannot score. And without scoring, you cannot win. To be able to accurately estimate team possessions opens up the whole world of advanced stats. Definitively, a possession is the period of play between when one team gains control of the ball and when the other team gains control of the ball. A possession ends when a team gives the ball to the other team, usually through a score, a turnover, or a missed shot recovered by the defense. So, in the theme of possessions, lets look at "Pace" first. Pace is measured by an average of team possessions and opponent possessions. Generally, teams that score faster, or turn the ball over more often, or create more turnovers, or force quick shots, will be higher up on the Pace scale. Win% is on the left verticle axis, and Pace is on the bottom horizontal axis...
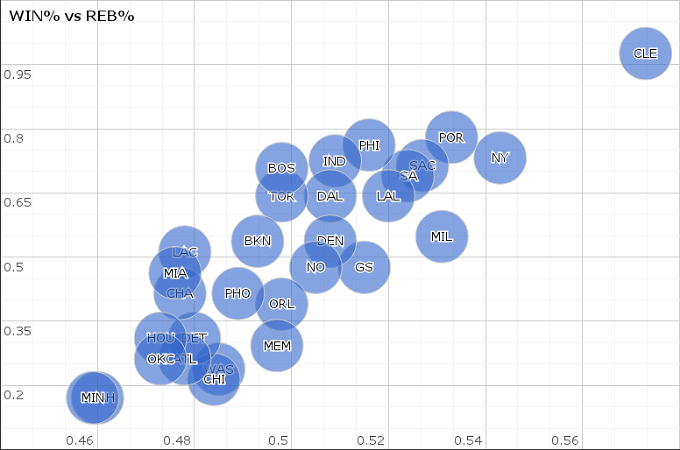
Correlation: 0.368 That is a fairly weak correlation there. The best team in the league (Cleveland) is just above average in pace. One of the league's average teams (Denver) is at the top. Another one of the league's average-ish teams is at the bottom (Golden State). We have a cluster of bad teams at the lower scale of pace, and a handful of good teams at the higher end of pace, but for the most part there is a weak correlation. Which is not overly surprising, given that pace is not a measure of team's ability, it is merely a measure of how fast a team plays. Conclusion: Weak correlation. Pace does not neccesarily = wins. Next up: Rebounding percentage. One of the most important facets of basketball is to secure possession after a shot is missed. Offensive rebounds regain possession, and defensive rebounds secure possession. And we all know how important possession is now, after my speil at the top. Win% is on the left verticle axis, and Reb% is on the bottom horizontal axis...
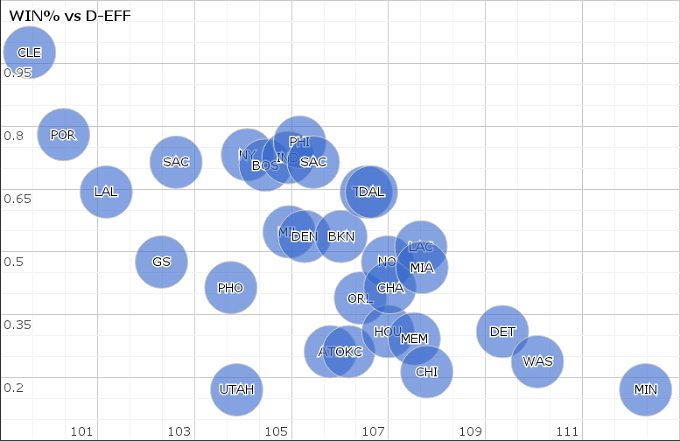
Correlation: 0.849 That is a strong correlation. As we can see, the best team in the league are also the best rebounders, and the two worst teams (Utah and Minnesota) are also the worst rebounders. In the middle pack, we can see a clear uphill trend that correlates a team's rebound rate to their win%. Conclusion: Strong correlation. Rebounding is very important for winning. Next up: Defensive efficiency, otherwise known as D-Eff, is the measurment of how many points a team allows their opponent to score per 100 possessions. (i.e. the lower your D-Eff the better). Part of winning basketball is to prevent the other team from scoring aswell as getting possession back, in order to carry on scoring more points than the other team. That's defense. But is that the case for the 2k engine? Or is it more of a points scoring race? Let's find out... Win% is on the left verticle axis, and D-Eff is on the bottom horizontal axis.
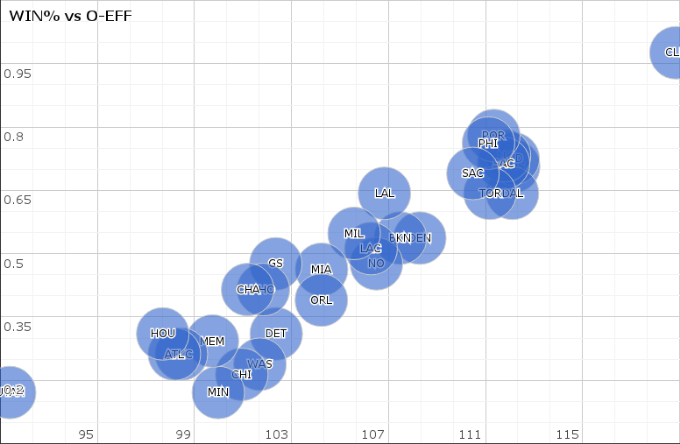
Correlation: 0.667 That is a moderate-to-strong correlation. Again the best team in the league (Cleveland) are at the best defensive team, along with Portland (another top team). Minnesota, one of the worst teams in the league, are also the worst defensive team in the league. So there are some correlations on the extreme ends of the scale. But the middle of the pack is a little less clear. There are some outliers here. Utah, one of the worst teams in the league, are a top 10 defensive team. Atlanta and OKC, two losing teams, are decent defensively. GSW, not a particularly amazing team, are top 5 defensively. There is a cluster of winning teams who are good defensively (NY, BOS, IND, PHI, SAC), but other than that it's a bit of a clusterfuck. Conclusion: Defense will definitely contribute to winning, but it is basically useless without being adequate in the other 2 important factors (O-Eff and Reb%). You can make the playoffs and be a below-average defensive team. It is important, but non-essential. But the good teams are in the top half. Next up: Offensive Efficiency. O-Eff is the measurment of points scored per 100 possessions. When looking at non-advanced team stats it's important to understand that some teams play faster than others which skews their per game stats. Faster paced teams will get more chances to score per game than a slower paced team, solely because they have more opportunities. This makes PPG and Opposition PPG a poor indicator of a team's offense/defense. By using points per possession, we're looking at how many points a team scores when they have the ball on offense. OEff is the purest stat to rate and rank team offensive performance accurately, because rather than ask the question - "how many points does a team score per game?", it asks - "if this team had the ball 100 times, how many points would it score?" Win% is on the left verticle axis, and O-Eff is on the bottom horizontal axis.
Correlation: 0.941 That is a very strong correlation. So strong that it is almost a perfect 1. We can clearly see the best team (Cleveland) is miles ahead of everybody, and Utah (one of the least winning teams) is way behind. There is a clear uphill trend here. Bad teams are at the bottom left and good teams towards the bottom right. There is a cluster of good teams near the top, and most of your usual losing suspects down the bottom, and everything in between is a perfect linear relationship. Conclusion: O-Eff is by far the most important ingredient to winning in NLL 2013/04. If you can't score, you can't win. Order of importance in 2k13: 1. Offense 2. Rebounding 3. Defense |
Archive· NLL Radio: The End of an Era · Correlations and Conclusions |
© 2001-2019 nbaliveleague.com | All Rights Reserved | About Us | FAQ | Sign Up | Contact Us | Site Statistics